![]()
|
back to the main page |
 |
| back to the software page |
 | |
![]()


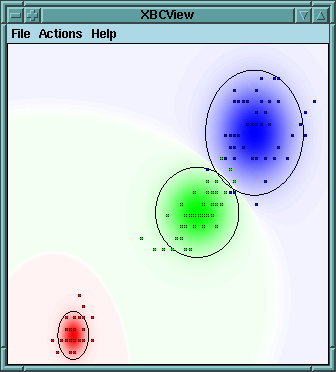
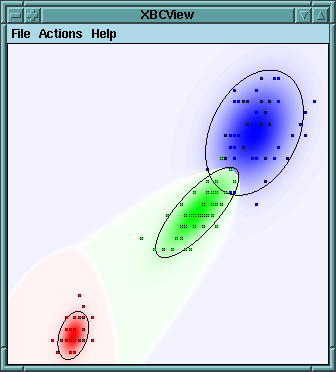
Each color is associated with a class: red - iris setosa, green - iris versicolor, blue - iris virginica. The intensity of the color is the conditional probability density. The left screenshot shows the naive Bayes classifier, the right one the full Bayes classifier. The ellipses are the 2sigma-boundaries of the probability density functions (compare Figure 6.2, Section 6.1.3, page 156).
These screenshots were generated from the induced classifiers with the Bayes classifier visualization program listed here.
![]()
Last updated: Mon Aug 28 16:10:20 CEST 2006 - christian@borgelt.net